Hi everyone,
I have built the Vrvfpgasim.exe. But after I generate the trace, there is no "trace.vcd" file. Could anyone provide some help? Thank you~
Sincerely,
Tony
Hi Tony,
I understand that you are using Windows 10 for the fact that you mention a .exe file. I also understand that you are replicating the steps shown in Section 7 of the GSG and that you are using Cygwin.
Am I right with all these assumptions?
If you have followed the steps from Section 7 - GSG carefully, the Verilator binary (Vrvfpgasim.exe) should have been compiled for exporting the trace (you can see in the verilatorSIM/Makefile that we are compiling with the --trace option: "VERILATOR_OPTIONS = --trace -Wno-fatal"). Thus, when you simulate a program, for example AL_Operations, the trace (with name trace.vcd) should be generated inside folder RVfpga/examples/AL_Operations/.pio/build/swervolf_nexys.
Please check this and let us know if you can resolve the problem or you need more help, in which case we'd need you to provide more details of what you are doing.
Best regards
Dani
Dear Dani,
Thank you, Dani~ Sorry for the late reply! Because I give up for a long time.
Yes, your assumption is right. But I am not sure that what you want to emphasis, could you please explain it again?
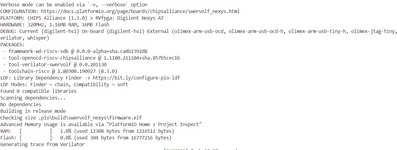
I was stuck by the step when I want to compile the file. I provide my screenshot and thank you for helping me since I thought no one would read this.
Thank you very much~
Sincerely,
Tony
Linking .pio\build\swervolf_nexys\firmware.elf
Generating disassembly
riscv64-unknown-elf-objdump -d ".pio\build\swervolf_nexys\firmware.elf" > ".pio\build\swervolf_nexys\firmware.dis"
Checking size .pio\build\swervolf_nexys\firmware.elf
Advanced Memory Usage is available via "PlatformIO Home > Project Inspect"
RAM: [ ] 1.0% (used 12304 bytes from 1216512 bytes)
Flash: [ ] 0.0% (used 268 bytes from 16777216 bytes)
Building .pio\build\swervolf_nexys\firmware.bin
Building .pio\build\swervolf_nexys\firmware.vh
Generating trace from Verilator
*** [generate_trace] 系統找不到指定的檔案。 (Chinese means "System can't find the certain file")
============================================================= [FAILED] Took 5.43 seconds =============================================================
Dear Dani,
Sorry for bothering you again~ I also want to ask which waveform we generate? Because the guide didn't notice that. So we don't know how this program execute and what these steps represent for. Thank you for your understanding~
Sincerely,
Tony
Hi Tony,
Yes, we always read the posts and answer them 🙂 (in fact we try to answer quite fast so that you don't get stuck for too long).
Your problem looks to be related with your system not being able to find the Verilator binary (Vrvfpgasim.exe file). In that case, the trace gets not generated at all. Can you review if you've done correctly step 5 in Section 7 of the GSG? That steps asks you to set the path for the Verilator binary; for example: board_debug.verilator.binary = [RVfpgaPath]\RVfpga\verilatorSIM\Vrvfpgasim.exe (note that [RVfpgaPath] is the route where you've placed the RVfpga package).
In Section 7 of the GSG we are simulating the execution of the AL_Operations program in our SoC, as that's the program that we've opened in VS Code (step 4). In the waveform, you can analyze any SoC internal signal for the execution of the AL_Operations program (for example, in Figure 90 we are analysing the Instruction Registers and the x28 register, but you could add any other signal that you want). This kind of simulations are extensively used in Labs 11-20 to analyse/modify the core operation.
Let us know if this resolves your questions or you need any extra help.
Best regards
Dani
Hi, dchaver,
Installed verialtor on a windows system using Cygwin. gcc-core 11.4 ,verilator v4.228
the report shows success, but the vcd wave file is not generated in the folder
Hi delete,
Please see the answer in the other post called "Cannot generated trace.vcd using the PlatformIO"
Dani


